

Summary
A typical GKE deployment serves about 90% of requests at normal speed, while about 10% are much slower, with no restart or traffic spike at the time. Some slowness is expected in any LLM service, because response time grows with the length of the answer, and reasoning models vary widely in how much they write. The first task in troubleshooting anomalous behavior is to separate requests that are slow because they had more work from requests that are slow for the same amount of work. Two per-request measurements, time to first token and time per output token, make that separation.
This guide explains those measurements, what the shape of the slow tail indicates and where time is lost inside a serving system. It closes with the questions that narrow the search and a proposed method in which no request data leaves the bank.
The problem as described
About 90% of requests respond normally and about 10% are much slower, at the same time and to the same model. The cause is unknown.
When a user reports a slow response, the team cannot identify the request or the reason.
The deployment runs on GKE and serves Qwen and gpt-oss models with data parallelism: several copies of the model, each taking a share of the traffic.
At the time of the slow requests there was no pod or GPU restart and no traffic spike.
How response time is measured
A request passes through four stages. The gateway chooses a copy of the model. The request waits in that copy's queue until the batch has room. The model reads the whole prompt in one pass, and then writes the answer one token at a time, a token being about three-quarters of an English word.
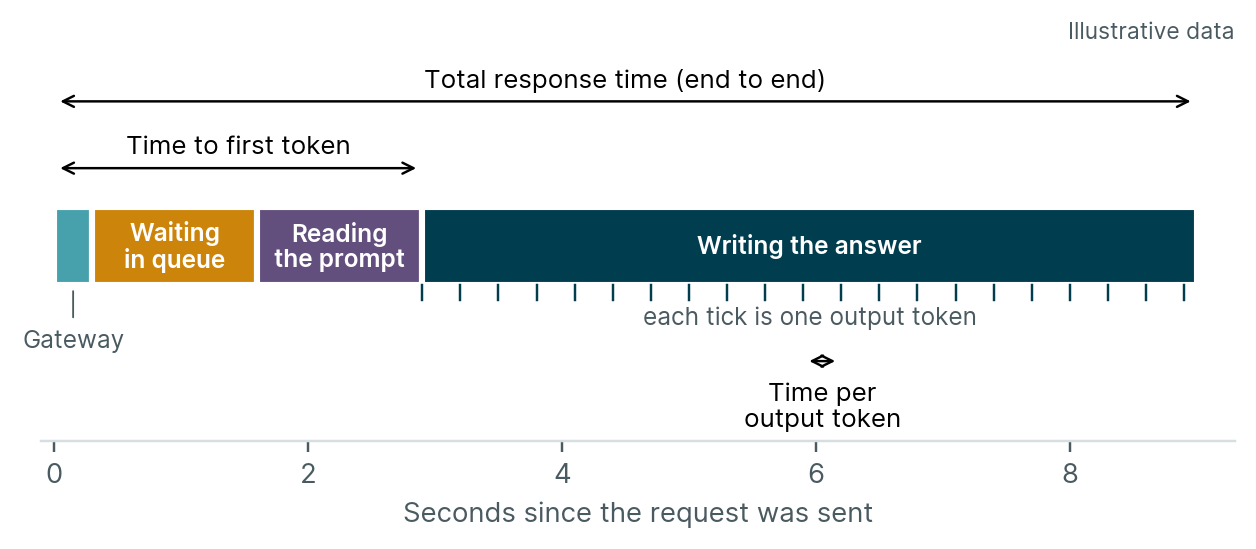
Four measurements describe a service:
Time to first token. From sending the request to receiving the first word of the answer. It covers the gateway, the queue and reading the prompt, and is what a user of a streaming chat interface feels as responsiveness.
Time per output token. The interval between successive tokens of the answer, which sets how fast the answer appears once it starts.
Total response time. From sending the request to receiving the last token. It is close to time to first token plus time per output token multiplied by the number of tokens in the answer.
Throughput. The tokens the whole service produces per second across all users. It describes the system rather than a single request.
Percentiles and the long tail
Response times in LLM serving are skewed. Most requests cluster at the low end and a minority stretches far to the right, so an average describes the distribution poorly. In Figure 2, the mean is 16 seconds, while the median request, P50, takes 12.
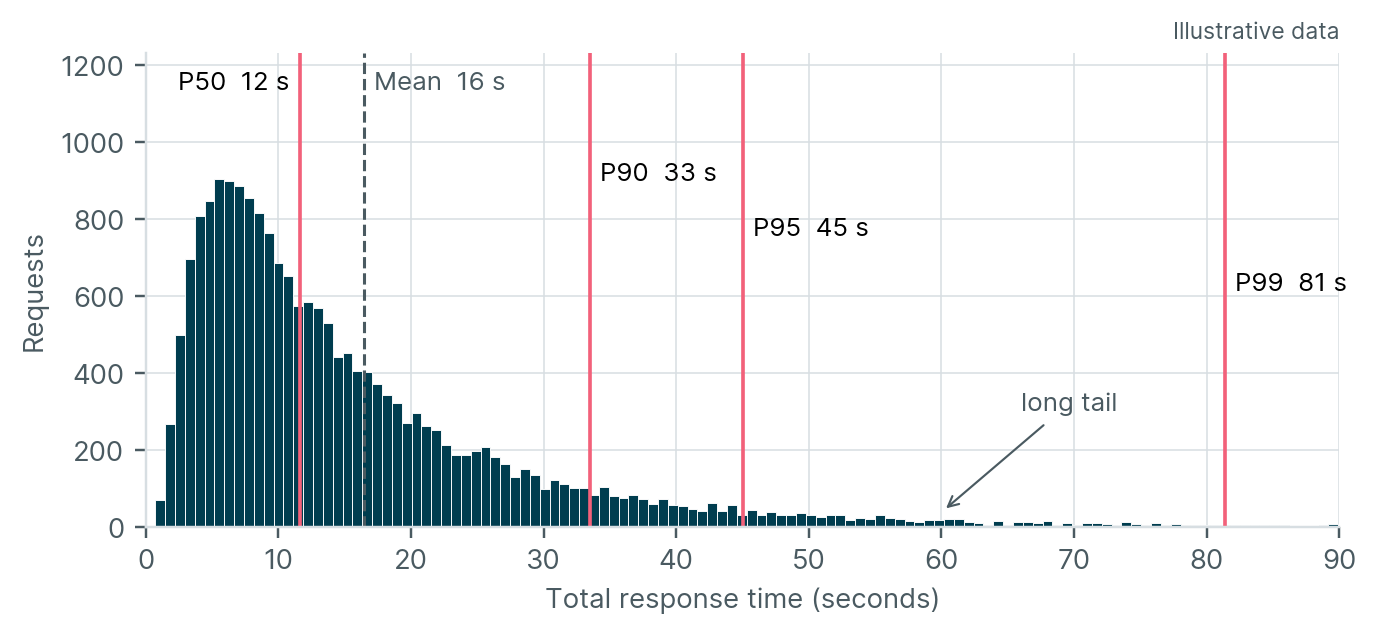
Percentiles describe it better. P90 is the time within which 90% of requests complete, 33 seconds in Figure 2. P95 is 45 seconds and P99 is 81 seconds, seven times the median, in a service with nothing wrong with it.
"90% normal and 10% slow" therefore places the start of the slowness near P90. Two facts are still missing: how much slower than the median the slow requests are, and whether the work they did explains it.
Workload or system
The total response time in Figure 2 is widely spread because answer length is widely spread. The server's own speed is not. Figure 3 shows the two per-request measurements for the same requests. Time to first token has a P99 twice its median, and time per output token a P99 1.3 times its median. On a healthy server, both stay in a narrow band regardless of the size of the request.
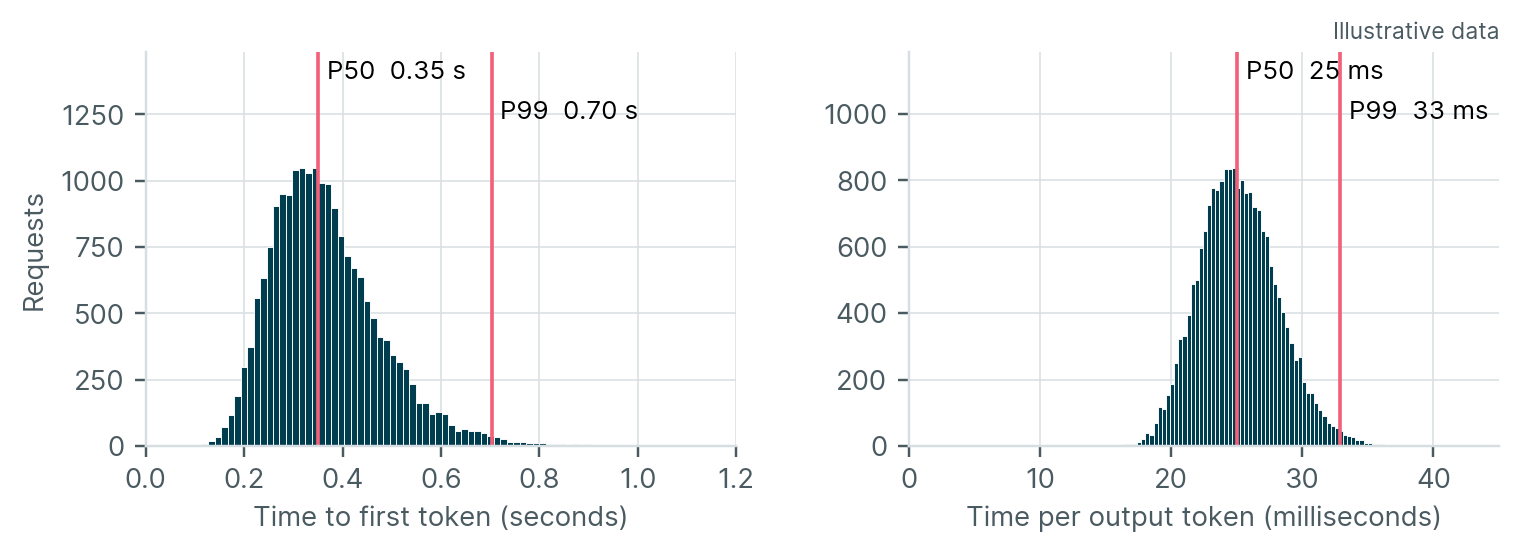
This gives the first test. If the slow requests show normal time to first token and normal time per output token, they are slow because they wrote long answers, and the remedy lies in how the models are configured and used. If either measurement is inflated on the slow requests, the serving system is the cause.
Figure 4 applies the test to every request at once, using two numbers most serving logs already hold: the number of tokens in the answer and the total time. A healthy server writes at a steady speed, so total time rises in proportion to answer length and the requests fall along the dashed line. A request on the line at the far right is slow only because its answer is long. A request well above the line wrote an ordinary number of tokens and still took much longer: two answers of 500 tokens, one taking 13 seconds and one taking 45, did the same work, and the extra 32 seconds were spent waiting in a queue, being evicted and restarted, or sharing a stalled batch. Those requests are the ones the rest of this guide sets out to explain.
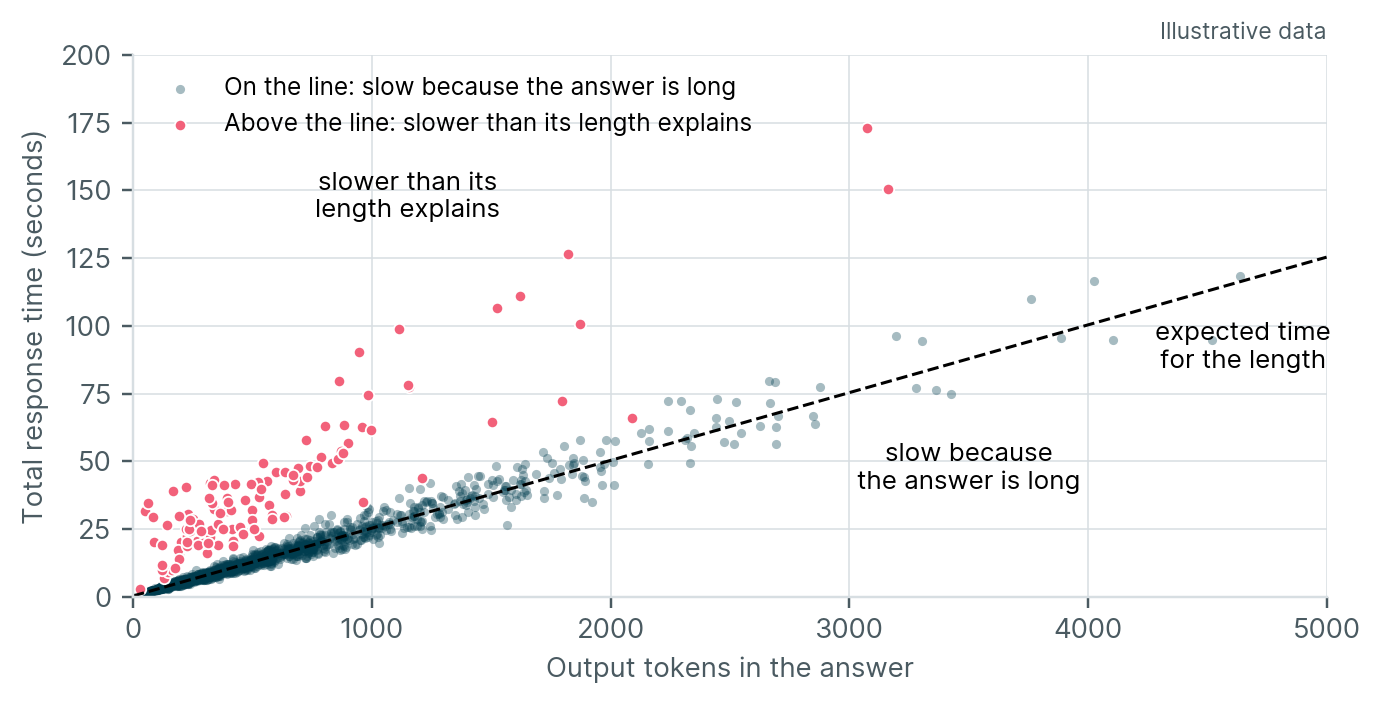
Reasoning models make the first case common. Qwen3 models can think before answering, and in several variants thinking is switched on or off per request. gpt-oss sets a reasoning effort of low, medium or high. The same question can produce a few hundred tokens or several thousand, and an interface that hides the reasoning shows the user a short answer that took a long time to arrive.
The shape of the tail
A histogram on a logarithmic time axis shows whether the slow requests continue the normal ones or form a separate group.
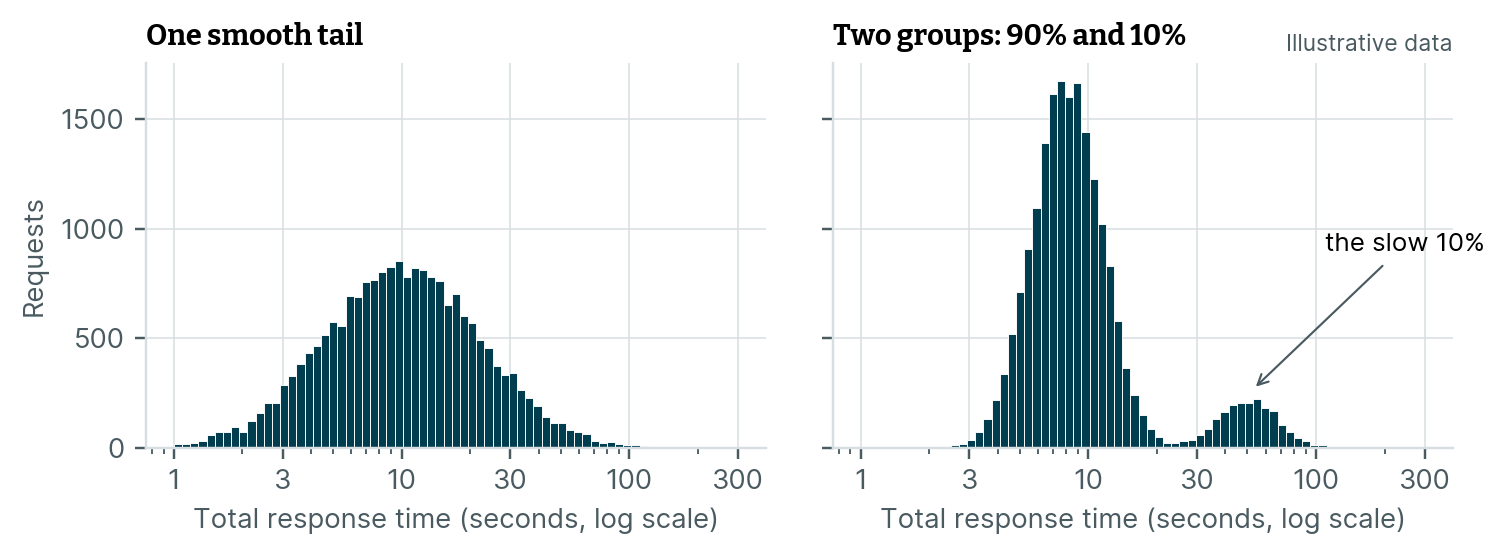
One smooth tail. Usually comes from queueing under load and from variation in request length. These causes act by degree.
Two distinct groups. Point to a switch, something that applies to some requests and not to others: thinking on for some requests and off for others, one overloaded copy of the model, requests evicted from GPU memory and restarted, prompts found in the cache against prompts that are not, or two GPU types or node pools behind one route.
A separate group holding 10% of requests suggests a switch. The shape of the distribution is the cheapest diagnostic available.
GPU memory and the KV cache
A serving GPU holds four things. The model weights are loaded once and stay. A working space holds the intermediate results, or activations, of the batch being computed. The serving framework keeps a smaller amount for its own use. Whatever remains, up to a configured limit, becomes the KV cache: the memory where the engine keeps each active request's prompt and answer so far, so that writing the next token does not require processing the whole conversation again.
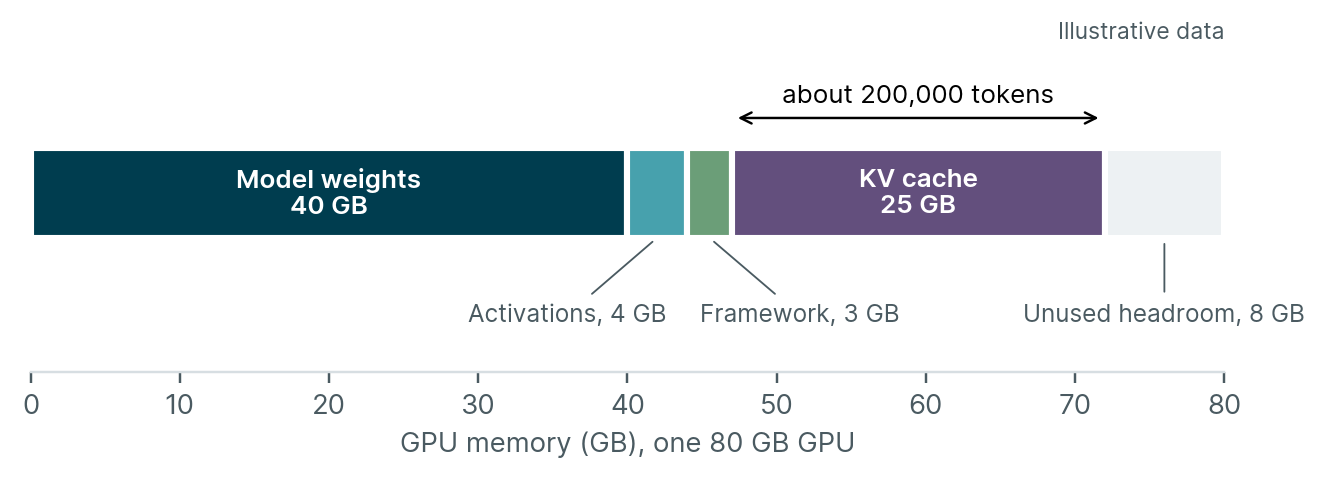
The KV cache therefore holds a fixed number of tokens, set by the GPU, the model and the configuration: about 200,000 in Figure 6. The number of requests it can hold is not fixed. Every active request occupies tokens equal to its prompt plus the answer written so far, so the same budget serves many short requests, a few long ones, or a mixture.
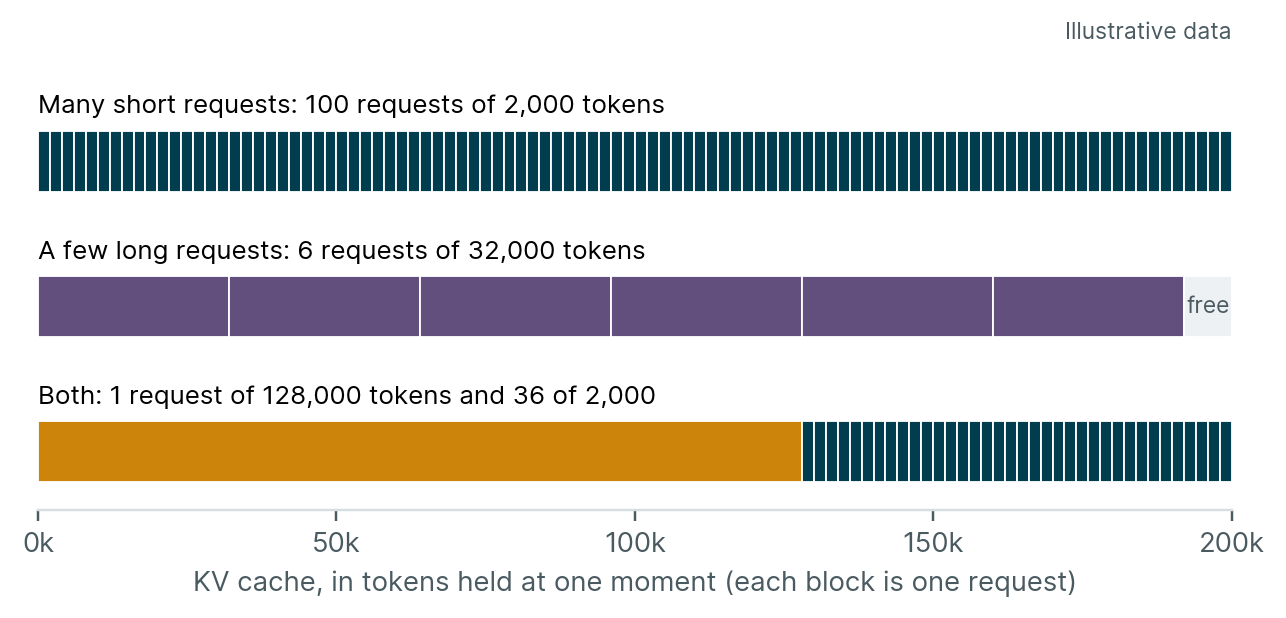
Time decides how the budget is spent. A request holds its tokens from the moment its prompt is read until its last token is written, and its share grows with every token it writes, so a long reasoning answer holds memory for longer as well as holding more of it. A single request with a very long prompt can take most of the cache, as in the third bar of Figure 7. When the cache is full the engine has two options, and both create slow requests at a steady traffic rate: it holds new requests in the queue until memory frees up, or it evicts a running request and recomputes it later.
Load, throughput and latency
A serving engine processes many requests together in a batch. Adding requests raises throughput, because the GPU does more useful work per step, and slows each request, because the requests share each step. In Figure 8, raising the number of concurrent requests from 16 to 256 triples throughput, from about 1,700 to 5,200 tokens per second, while the P99 time for a 500-token answer grows from 6 to 73 seconds. Near the right of the curve a small rise in load produces a large rise in the tail.
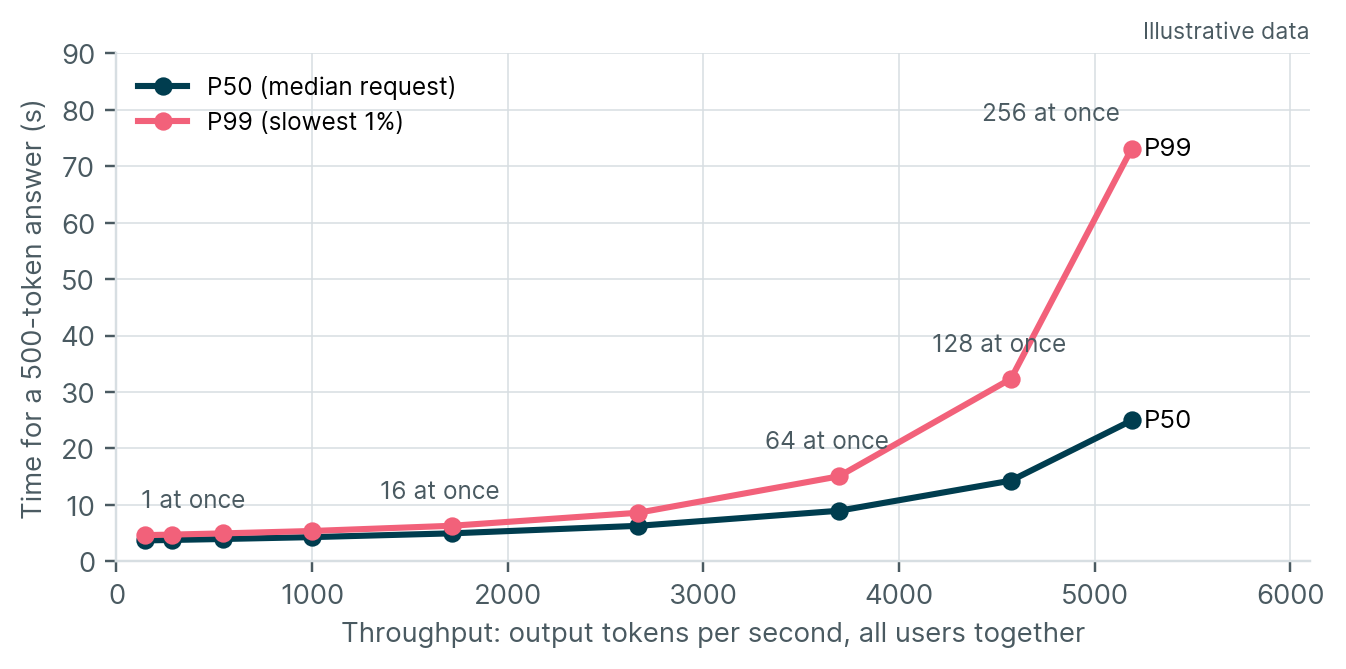
Two consequences bear on any anomalous performance observation. Total traffic can stay flat while one copy of the model sits at the right of this curve, because the gateway sends it a larger share of the work, such as several long prompts at once. The requests on that copy are then slow while requests on the other copies are normal, at the same moment.
Where time is lost
Each stage in Figure 1 has its own causes and its own signal. Comparing slow and normal requests from the same minutes shows which stage grew.
Stage | Grows on a slow request | Typical causes | Confirming signal |
|---|---|---|---|
| Gateway and network | Client-side time exceeds the time the server recorded | Retries after a timeout, proxy buffering of streamed responses, connections pinned to one copy | Gay between client and server time; duplicate request IDs |
Queue | Queue time, and with it time to first token | One copy overloaded while others are idle; GPU memory full, so new requests wait | Queue length and memory use for each copy, never only the total |
Reading the prompt | Prompt time, and with it time to first token | Very long prompts; prompt not found in the cache | Input tokens and cache hit rate of slow requests |
Writing the answer | Time per output token | Long prompts on the same copy stalling the batch; requests evicted from memory and recomputed | Time per output token against long-prompt arrivals; eviction count |
None: the workload | Output tokens, with normal per-token speed | Long answers and reasoning | Output tokens of slow requests |
Two further causes sit outside the table. Qwen3 mixture-of-experts variants and gpt-oss are mixture-of-experts models. When such a model runs in vLLM's data-parallel mode, the copies synchronise at every step, so a long prompt on one copy briefly slows all of them, which produces slow windows across many requests rather than a fixed slow 10%. A degraded GPU or node produces slow requests concentrated on one machine.
First questions
What does "slow" mean to users: time to the first word or time to the complete answer? Are responses streamed?
What is measured today, at which percentiles, and against what target?
How much slower are the slow requests, twice the median or twenty times? Does the distribution show a gradual tail or two separate groups?
Do the slow requests produce more output tokens than the normal ones?
Are thinking mode for Qwen and reasoning effort for gpt-oss set per request, and does the mix differ by application or user?
Do slow requests arrive at random or in clusters in time, and are they concentrated on particular users, applications or machines?
Which serving engine and version run the models, which models and sizes, and how is data parallelism configured?
What routes traffic to the copies of the model: a Kubernetes Service, an ingress or an inference gateway, and with what balancing policy?
Proposed method
Record every request. One record per request carrying a request ID, the copy of the model that served it, input and output tokens, queue time, time to first token, time per output token and total time, with the same ID carried from the client through the gateway. Current vLLM already emits most of these per request through its OpenTelemetry tracing.
Compare slow and normal requests from the same minutes. The table above maps the stage that grew to a short list of causes.
Reproduce the tail in a non-production environment under load shaped like production.
Change one setting at a time and measure P99 before and after each change.
The analysis runs inside the customer’s environment. Thoughtworks supplies the method and the queries, and only aggregate figures leave the customer’s network. No prompt or answer content is needed at any step.