

Abstract
A consulting firm, simulated here, wants NVIDIA Nemotron 3.5 Super VL, checkpoint BF16-09212026, to extract figures from years of client charts. The firm needs the model to report the total number of labeled ticks across a chart's axes, which requires locating the subplot, identifying each axis, reading its tick labels, counting them and adding the counts. Because customer charts are proprietary, the 224 compositionality questions of the public CharXiv chart benchmark stand in for the firm's archive. A LoRA adapter trained for 3.3 hours on 24,000 generated charts, with no CharXiv figure in training, raised accuracy on those questions from 16.96% to 78.13%, a gain of 61.16 percentage points. On 300 held-out generated charts, accuracy rose from 18.33% to 99.33%. Separately, on the original checkpoint, the multi-token prediction head it ships with raised single-request output speed by a factor of 1.56. For a real customer, Thoughtworks recommends the same method: train on generated charts shaped like the customer's question and measure on the customer's own charts, which need not enter training. All results were measured on the pre-release checkpoint BF16-09212026, before GA (general availability). The GA checkpoints are the completed post-training release, with improvements across multimodal, verbosity, chat and instruction following, and the results have not been re-measured on them.
1. Setup
In the simulated scenario, a consulting firm adopts Nemotron 3.5 Super VL to extract figures from the charts it has accumulated over years of engagements. The firm needs the model to report the total number of labeled ticks across all axes of a chart. Out of the box, the original checkpoint answers this question correctly on 38 of 224 evaluation items (Table 5), and Thoughtworks fine-tunes it to raise its accuracy on this task.
For this demonstration the study cannot use proprietary customer charts, so it uses CharXiv, a public benchmark of questions about charts taken from arXiv papers, as a stand-in for the firm's archive. CharXiv's compositionality category asks exactly this question in 224 items, which form the evaluation set.
The category takes its name from the fact that one answer combines several steps: locate the subplot, identify each axis, read and count its tick labels, and add the counts. The training charts were generated (Section 1.3), so no evaluation chart enters training.
Thoughtworks trained and scored one LoRA adapter on BF16-09212026. LoRA (low-rank adaptation) fine-tunes a model by training small matrices added to its frozen weights.
1.1 Checkpoint, hardware and software
The checkpoint is NVIDIA's early-access post-training release of Nemotron 3.5 Super VL, downloaded as 80 files totaling about 249 GB. This report labels it BF16-09212026. No figure in this report comes from the earlier pre-release checkpoint, BF16-09112026.
Table 1. Configuration common to every result in this report.
Item | Value |
|---|---|
Checkpoint | BF16-09212026, BF16 weights, 88 decoder layers (40 Mamba-2, 8 attention, 40 MoE), 512 routed experts with 22 active, C-RADIOv4-H vision encoder |
Hardware | One node of 8 NVIDIA H200 (139.81 GiB usable per card), driver 570.133.20 |
Cards used for training | 4 (cards 4 to 7), PyTorch FSDP2 four-way sharding |
Cards used for serving | 4, vLLM at tensor parallel 4 |
Training stack | Hugging Face Transformers Trainer with PEFT LoRA, mamba_ssm and causal_conv1d installed, Mamba-2 mixer forced onto its non-split kernel path |
Serving stack | vLLM, up to 16 images a prompt, maximum 32 concurrent sequences, GPU memory utilization 0.85 |
Evaluation harness | VLMEvalKit at commit 2ae7b28b, Python 3.12.3 |
Sampling | Temperature 0, maximum 1,024 output tokens, reasoning disabled through enable_thinking: false |
1.2 Selection of the stand-in task
To choose the task, Thoughtworks scored the original checkpoint on ten public vision benchmarks (AI2D, ChartQA, ChartQAPro, CharXiv descriptive, CharXiv reasoning, MathVista, MMMU, OCRBench, OCRBench v2 and OCR-Reasoning), about 26,600 items in total. Among chart questions, the lowest score was on CharXiv's compositionality category, 16.96% over 224 items. CharXiv uses a single question template for that category: the total number of explicitly labeled ticks across all axes.
Table 2. Original BF16-09212026 on CharXiv descriptive templates, the compositionality template against the templates measuring its ingredients.
Template | Items | Accuracy |
|---|---|---|
Total labeled ticks across all axes (compositionality) | 224 | 16.96% |
Read one labeled tick (four templates) | 979 | 95.30% |
Give the subplot layout | 247 | 97.57% |
Give the number of subplots | 65 | 92.31% |
The original model reads a single tick label, the subplot layout and the number of subplots correctly 92% to 98% of the time, but totals the ticks correctly only 17% of the time. It reads the individual parts and fails to combine them. The adapter trains only the language model and leaves the vision encoder frozen, so it can change how the model combines what it sees but not what it sees.
1.3 Training corpus
CharXiv's dataset card prohibits training on its figures, so Thoughtworks generated the training charts. Each chart is drawn from plotting code, so the correct tick count is known before the chart exists. The corpus holds 24,000 training rows and 1,985 held-out rows, one chart each. Charts whose tick labels overlapped other text, 1,649 in total, were discarded.
Each row asks for the total number of labeled ticks. The target answer, the text the model is trained to produce, lists the labeled ticks on every axis, adds them and ends with the line Answer: N. Across the 24,000 training rows the target answer is 104 tokens long at the median and 111.2 on average. Each chart image adds 702.7 tokens on average, and a full row averages 851.8 tokens, with a maximum of 1,393.
The generated totals follow CharXiv's: both range from 4 to 42 with a median of 12, and the means are 11.9 and 12.58. Single-panel charts make up 44% of the corpus and 37% of the benchmark. No generated chart is byte-for-byte identical to any of the 2,323 CharXiv figures, and no held-out chart shares its specification (layout, shared axes, chart type and axis labels) with a training chart. Fifteen held-out rows that repeated a training question with the same answer were removed before training, leaving 1,985 of the original 2,000.
1.4 Adapter and training
The adapter and optimizer settings are the same as in the legal and healthcare experiments of report 2; only the training data differs.
Table 3. Adapter and training configuration of the chart experiment on BF16-09212026.
Item | Value |
|---|---|
Adapter identifier | n35-charts-tickcount-37e8c071c9-600-a2-BF16-09212026 |
Adapter type | LoRA, rank 64, alpha 128 (scaling 2.0), dropout 0.0, no bias, rsLoRA off |
Target modules | 272 language-model projections: Mamba-2 in_proj and out_proj (40 each), attention q_proj, k_proj, v_proj, o_proj (8 each), MoE fc1_latent_proj and fc2_latent_proj (40 each), shared-expert up_proj and down_proj (40 each) |
Frozen | Vision encoder, vision projector, all 512 routed experts, MTP head, lm_head |
Trainable parameters | about 177 million |
Corpus | 24,000 generated chart rows |
Steps and batch | 600 steps, global batch 32 (per-device batch 1, 8 accumulation steps, 4 ranks), 19,200 sequences or 0.8 epochs |
Maximum length | 4,096 tokens, no row truncated |
Optimizer | AdamW, learning rate 7.1e-5, cosine decay to 10% of peak, 10% warmup, weight decay 0.01, betas 0.9 and 0.95, gradient clip 1.0 |
Precision and memory | BF16, activation checkpointing on |
Seed | 20260918 |
Supervision | The whole assistant turn, derivation and answer |
Wall time | 3.30 hours end to end |
After training, the adapter was merged into the base weights, and every score in Section 2 comes from the merged model. The merge was checked to be exact: each of the 272 merged weight matrices equals the base plus the scaled adapter to within the smallest step of the bfloat16 format. On 256 held-out rows, the merged model and the unmerged adapter differ on one predicted token.
1.5 Evaluation
Two measurements compare the adapter with the original model, both on the same items and with the same serving and sampling settings (Table 1).
Generated held-out split. 300 rows drawn at random (seed 20260923) from the 1,985 held-out rows. The scorer takes the number on the Answer: line, or the last number in the reply if that line is missing, and compares it with the true count from the plotting code.
CharXiv descriptive validation. All 4,000 descriptive questions in five categories, run through VLMEvalKit, an open-source evaluation toolkit; the 224 compositionality items are the target. VLMEvalKit grades each reply by sending it, the correct answer and a grading prompt to a second model, the judge, which returns 0 or 1.
Judge model. The original BF16-09212026, served locally with reasoning disabled, graded the replies of both models, so both sides of the comparison were scored by the same judge. No request left the machine.
Token accuracy during training, the share of target tokens the model predicts correctly when given the preceding target text, is not used as evidence. The Answer: N line is 4.7 of the roughly 110 target tokens, 4.25%, so a model that copied every derivation but got every count wrong would still score about 95.7%. The measure reached 99.65% at step 50 and 100% by step 575.
Two rules fixed before measurement.
Acceptance of the generated split. Before training, the original model is scored on the generated charts. If it scores 40% or less, the generated charts are accepted as a stand-in for CharXiv; above 40%, the corpus is rebuilt. The threshold is loose because the two measurements read answers differently.
Length check. The original model wrote long replies on this task, while the training targets are short, so a gain could come from the adapter stopping sooner rather than counting better. Items are split by whether the original model's reply exceeded 3,000 characters. A gain only among long replies is read as a formatting effect; a gain among both long and short replies is read as better counting. The split uses the original model's reply length only, because training changes the adapter's reply length.
2. Results
Every score in this section was measured under the configuration in Table 1.
2.1 Acceptance of the generated split
The original model answered 55 of the 300 held-out rows correctly, 18.33%, with a 95% confidence interval (Wilson score) of 14.36% to 23.10%. The interval contains the model's 16.96% on CharXiv compositionality, so the generated charts were accepted as a stand-in. Of the 300 replies, 33 (11%) exceeded 3,000 characters and ran to the 1,024-token limit. Even counting all 33 as correct, 3 of which already were, the score would be 85 of 300, 28.33%, still below the 40% threshold.
2.2 Generated held-out split
The adapter answered 298 of the same 300 rows correctly, 99.33%, against 18.33% for the original model, a gain of 81.00 percentage points. No request failed and no item was excluded. None of the adapter's 300 replies is identical to the original model's reply. Scoring the original model a second time gave the same 55 correct.
Table 4. Accuracy on 300 generated held-out rows, split by the length of the base's reply, as registered before scoring. Mean reply length in characters.
Stratum (base reply) | Items | Base | Adapter | Gain, points | Base chars | Adapter chars |
|---|---|---|---|---|---|---|
Over 3,000 characters | 33 | 9.09% | 93.94% | +84.85 | 3,444 | 303 |
Under 3,000 characters | 267 | 19.48% | 100.00% | +80.52 | 171 | 223 |
All | 300 | 18.33% | 99.33% | +81.00 | 531 | 232 |
The gain is similar for long and short replies, 84.85 and 80.52 points, so under the rule fixed before scoring it reflects better counting. On the 267 items where the original model's reply was already short, the adapter writes longer replies, 223 characters against 171 on average, and accuracy rises from 19.48% to 100%. The adapter's two wrong answers are each off by at most 3.
2.3 CharXiv descriptive
Table 5. CharXiv descriptive validation, original BF16-09212026 against the chart adapter, both judged by the original BF16-09212026. Correct counts in parentheses.
Category | Items | Base | Adapter | Change, points |
|---|---|---|---|---|
Compositionality (labeled-tick total), the trained question | 224 | 16.96% (38) | 78.13% (175) | +61.16 |
Counting | 393 | 87.28% (343) | 87.53% (344) | +0.25 |
Pattern recognition | 458 | 89.30% (409) | 88.86% (407) | -0.44 |
Information extraction | 1,686 | 94.48% (1,593) | 92.29% (1,556) | -2.19 |
Enumeration | 1,239 | 94.27% (1,168) | 88.94% (1,102) | -5.33 |
Descriptive overall | 4,000 | 88.78% (3,551) | 89.60% (3,584) | +0.83 |
All 4,000 questions were answered and graded without a failed request. On compositionality the adapter answers 144 items correctly that the original model missed and misses 7 that it answered, a net gain of 137 (p = 2.3e-34, exact McNemar test, a paired test on the items where the two models disagree). On the 3,776 items of the four categories the adapter was not trained on, it loses 211 items and gains 107, a net loss of 104 (p = 5.6e-9). The loss is in enumeration, 66 items (p = 1.7e-8), and information extraction, 37 items (p = 4.5e-4). The changes in pattern recognition, net -2 (p = 0.84), and counting, net +1 (p = 1.00), are not significant.
Check without the judge. Every compositionality answer is a whole number, so both models' replies were also scored by the rule used on the generated charts: take the number on the Answer: line, or the last number in the reply. Every original-model reply is a bare number of one or two digits; 222 adapter replies have an Answer: line and 2 end on a bare number. The rule gives 38 and 175 correct, 16.96% and 78.13%, and agrees with the judge on every item for both models.

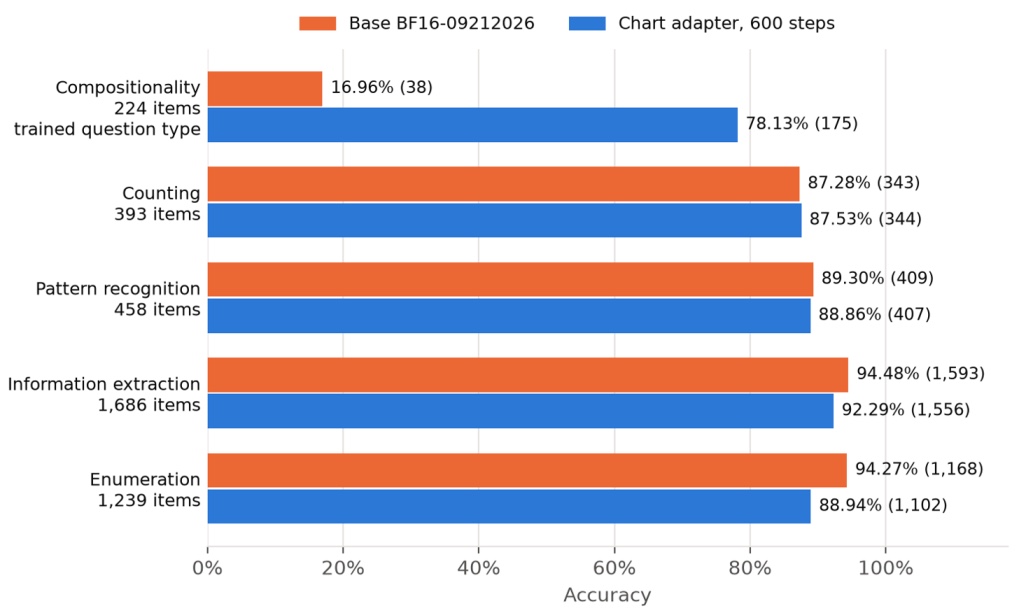
Five of the 18 question templates the adapter was not trained on lost more than 5 points (Table 6).
Table 6. CharXiv descriptive templates whose accuracy changed by more than 5 points, with items lost and gained and the exact McNemar p, Holm-adjusted over the 18 untrained templates.
Template | Category | Items | Base correct | Adapter correct | Change, points | Lost | Gained | p |
|---|---|---|---|---|---|---|---|---|
Total labeled ticks across all axes | Compositionality | 224 | 38 | 175 | +61.16 | 7 | 144 | 2.3e-34, not adjusted |
Difference between the maximum and minimum colorbar tick labels | Enumeration | 282 | 272 | 223 | -17.38 | 54 | 5 | 3.4e-10 |
Label of the x-axis | Information extraction | 230 | 218 | 197 | -9.13 | 24 | 3 | 8.4e-4 |
General trend of data from left to right | Pattern recognition | 36 | 32 | 30 | -5.56 | 3 | 1 | 1.00 |
Maximum colorbar tick label | Enumeration | 313 | 309 | 292 | -5.43 | 20 | 3 | 0.0078 |
Label of the y-axis | Information extraction | 233 | 215 | 203 | -5.15 | 16 | 4 | 0.18 |
Three of these five remain significant after correcting for testing 18 templates: the colorbar range, the x-axis label and the maximum colorbar label. The two colorbar templates account for a net 66 of the 104 items lost, 74 lost and 8 gained. Every training row asked the same tick-total question.
2.4 Training cost and memory
Before the 600-step run, a 25-step run with the same settings and data set the expected step time and memory. Table 7 compares those expectations with the 600-step run.
Table 7. Training cost of the chart experiment on four H200 GPUs, declared from the 25-step run against measured on the 600-step run.
Quantity | 25-step run, declared | 600-step run, measured |
|---|---|---|
Seconds a step, step 1 excluded | 15.438 (96 measurements, s.d. 0.505) | 14.904 (2,396 measurements, s.d. 0.386) |
Peak allocated per card, GiB | 72.24 (accepted range 70 to 80) | 72.27 |
Peak reserved per card, GiB | 73.42 | 73.59 |
First logged loss | 0.4 to 1.2 (chance level 11.78) | 0.5026 |
Trainable parameters | about 177 million | about 177 million |
Stepping time, hours | 2.57 projected | 2.48 |
Steps were 3.5% faster than expected. Each of the 2,396 step-time measurements is one GPU's time for one step, 599 steps on four GPUs. The run took 3.30 hours in total: 2.48 hours of training steps, about 20 minutes encoding the 25,985 chart images, about 6 minutes loading weights, and the rest on 24 held-out evaluations and 24 checkpoint saves. Each GPU had 66.22 GiB of its 139.81 GiB free.
Chart rows average more tokens than the legal rows of report 2, 851.8 against 725.1, but none exceeds 1,393, while legal rows reach the 4,096-token limit. Each training step waits for its longest row.
Processing the chart image adds 0.183 seconds to a step, a factor of 1.0079, and 0.01 GiB of peak memory. This was measured on one 888-token row, run once with its chart and once with the chart replaced by text of the same length, on a model split across three GPUs. That setup differs from training, so only the ratio applies to the training run.
3. Speculative decoding with the built-in prediction head
This section reports a separate measurement on the original checkpoint, independent of the chart adapter. Speculative decoding speeds up generation: a small predictor drafts the next token and the full model checks it in the same step, so one step can produce more than one token. The checkpoint ships with such a predictor, a multi-token prediction head (1,040 tensors under language_model.mtp) that drafts one token ahead. It was measured as shipped, in vLLM 0.28.1rc1 with one speculative token, against the same server with speculation off.
With the head enabled, the model did not fit on two GPUs at 0.85 memory utilization and an 8,192-token context: the weights and the head left no room for the KV cache, the memory that stores attention keys and values for tokens already processed. On four GPUs each card holds 55.81 GiB of KV cache, and both configurations in Table 8 ran on four H200 GPUs.
Table 8. Original BF16-09212026 with the multi-token prediction head off and on. 20 GSM8K prompts, temperature 0, natural end of sequence, maximum 1,024 output tokens, one request in flight.
Measure | Head off | Head on | Ratio |
|---|---|---|---|
Output tokens a second | 202.9 | 316.9 | 1.56 |
Mean milliseconds per output token | 4.828 | 3.038 | 1.59 |
Mean milliseconds to first token | 57.32 | 58.9 | — |
Mean output tokens a request | 532.0 | 536.9 | — |
Share of requests ending at natural end of sequence | 0.85 | 0.85 | — |
Each configuration was run once. On average each step produced 1.957 tokens out of a possible 2.0, so 95.7% of drafted tokens were accepted. If drafting cost no time, the speedup would equal 1.957; the measured 1.56 is 20.2% below that. Time to first token changed by 1.58 milliseconds.
At temperature 0, speculative decoding is designed to produce the same tokens as the model alone, so the two configurations should produce replies of the same length. On average they differ by 4.9 tokens a request. Whether the outputs match token for token has not been checked, so the 1.56 factor is a speed measurement only. It describes the prediction head shipped in BF16-09212026.
4. Limitations
The generated charts were built by Thoughtworks, with answers known from the plotting code. Their result does not measure accuracy on charts from other sources; CharXiv, drawn from published papers, does.
The CharXiv gain is on one question template, 224 items. The adapter was scored on CharXiv descriptive only, not on the other nine benchmarks, CharXiv reasoning or any text benchmark.
CharXiv scores come from a judge model, here the original BF16-09212026 for both models, and no second judge was run. VLMEvalKit's log files label the judge gpt-4o-mini, its default name, although the local server was called. On compositionality, scoring without the judge agrees with the judge on every item; the other categories were scored by the judge only.
Both models were scored with reasoning off and a 1,024-token limit. The original model's score with reasoning on, its default setting, was not measured, so how much of the gap reasoning alone would close is unknown.
The result comes from one training run, scored once at temperature 0, with no repeat. Paired tests were computed for CharXiv (Section 2.3) but not for the generated charts.
The training settings differ from NVIDIA's published LoRA recipe for Super VL, which uses a constant learning rate of 2e-4, global batch 8 on eight GPUs and expert parallelism 8; this experiment used 7.1e-5 with cosine decay, global batch 32 on four GPUs and no expert parallelism.
The PyTorch, Transformers and PEFT versions used in training were not recorded; the vLLM version, 0.28.1rc1, was recorded for every serving run.
The base weights of BF16-09212026 are identified by file count, byte count and a structural check against NVIDIA's NGC registry entry.
Scores in this report are not comparable with NVIDIA's published benchmark numbers. Every comparison in this report is between two measurements taken under one harness, one judge and one configuration.
The speculative-decoding result covers 20 prompts from one dataset, one temperature, one request at a time and one run per configuration, so it does not describe throughput under concurrent load. The head was not trained and was measured only on the original model.
All measurements are on H200. No Blackwell hardware was available.
All results are on BF16-09212026 and none has been re-measured on the GA checkpoints.
5. Next steps
Check that the prediction head produces token-for-token identical output at temperature 0 (Section 3), then measure speculative decoding on the adapted model.
Score the original model on compositionality with reasoning on, to measure how much of the gap reasoning closes without training.
Score the adapter on CharXiv reasoning and two or three other benchmarks, to test whether its effect stays within chart questions.
Train on a mix of general chart data and tick-total rows, to measure how much of the loss on other templates can be recovered.
A re-check on the GA checkpoints of the headline results, including the prediction head's speedup and its output-length difference.
6. Conclusion
In the simulated scenario, a consulting firm needs Nemotron 3.5 Super VL to total the labeled ticks on its charts, a question the original checkpoint answers correctly 16.96% of the time on the CharXiv stand-in. A LoRA adapter that trains only the language model, with the vision encoder frozen, raised accuracy to 78.13% on the 224 CharXiv compositionality items. The adapter was trained on 24,000 generated charts and never saw a CharXiv figure. On the generated charts the gain appears for both short and long replies, which indicates better counting rather than shorter answers.
The gain is limited to the trained question. On the four categories the adapter was not trained on, it shows a net loss of 104 items, 211 lost and 107 gained (p = 5.6e-9), 66 of them on the two colorbar templates. The training corpus asks a single question. For a production adapter, Thoughtworks recommends mixing general chart data into training to limit this loss; this study did not measure the effect of such a mix. All results come from one training run, scored once.